| Geography 226 | Lab 9 |
| Regression |
| You can fool too many of the people too much of the time. |
| - James Thurber - |
1. Explain the fundamental difference between correlation and regression.
2. Regression analysis distinguished between three types of variation.
Define each type of variation and draw a diagram to illustrate your definitions.
3. The Los Angeles Catalyst Study (LASC) assessed the effectiveness of the catalytic converter . As part of this research, the Environmental Protection Agency established carbon monoxide (CO) monitoring stations along the San Diego Freeway. Hourly CO averages were recorded on summer weekdays at stations located 25 feet from the freeway. Researchers believe that there is a linear relationship between observations of CO concentration (parts per million) and traffic density (traffic counts). The data reside in the file Traffic.sav.
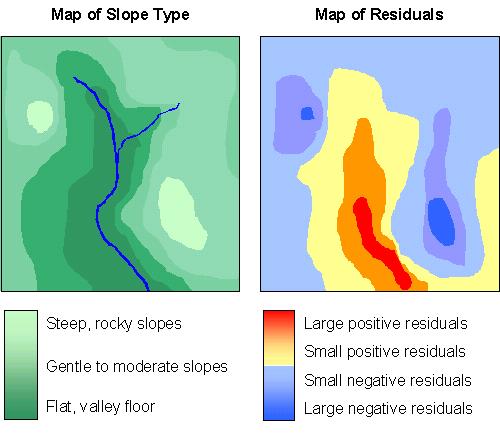
4. A geographer conducted regression analysis for tree height = f(soil moisture) in a small local watershed. She notices some large outliers (positive and negative) in the residual plot. To investigate these outliers, she wants to know where they are located in the watershed. Luckily, she recorded the coordinates of her samples, so she prepares a map of the residuals. She compares the residual map to a map showing slope types (steep to flat).
Explain what the residual map indicates about the performance of her prediction equation. (i.e. where does the line of best fit equation over or under-predict tree height based on soil moisture?)
|
|
| Show all your steps for conducting the analyses.
For SPSS instructions, go to the SPSS Help manual and click to Statistical Tools |
| Marking Guide (Lab Total = 40) | ||
|---|---|---|
| Question | Mark | |
| Q1 | 2 | |
| Q2 | 5 | |
| Q3 | a | 13 |
| b | 6 | |
| c | 4 | |
| d | 4 | |
| e | 3 | |
| Q4 | 3 | |
| © University of Victoria 2000-2001
Geography 226 - Lab 9 Developed by S. Adams and M. Flaherty Updated: 17 Nov2003 |